Mastering Data Analysis and Visualization
- Description
- FAQ
- Reviews

What is "Mastering Data Analysis and Visualization" about?
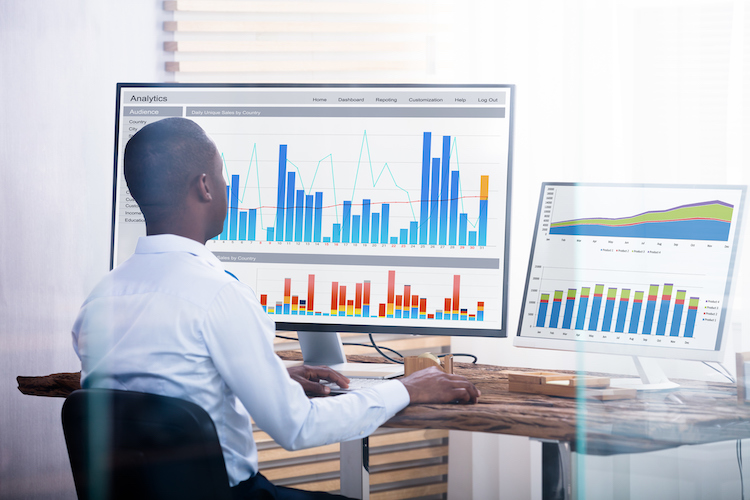
"Mastering Data Analysis and Visualization" is a comprehensive course that equips learners with essential skills and techniques in analyzing data and creating impactful visualizations. The course covers topics such as data preprocessing, exploratory data analysis (EDA), statistical analysis, machine learning, and the use of visualization tools to communicate insights effectively.
Who is this course for?
This course is designed for anyone interested in leveraging data to make informed decisions and communicate findings effectively. It is suitable for beginners looking to enter the field of data analysis, as well as professionals seeking to enhance their skills in data visualization and analysis techniques.
What are the prerequisites for taking this course?
Basic familiarity with programming concepts and some knowledge of statistics would be beneficial but not mandatory. The course is structured to accommodate learners with varying levels of experience, providing foundational knowledge alongside advanced topics in data analysis and visualization.
What will I learn from this course?
By the end of the course, you will:
•tUnderstand the importance of data preprocessing and how to clean and prepare data for analysis.
•tConduct exploratory data analysis (EDA) to uncover patterns, trends, and relationships within datasets.
•tApply statistical methods and hypothesis testing to derive insights and validate findings.
•tUtilize machine learning techniques for predictive analytics and decision-making.
•tCreate effective data visualizations using tools like Matplotlib, Seaborn, and Plotly to communicate insights clearly and persuasively.
Are there any projects or assignments in this course?
Yes, the course includes hands-on projects and assignments designed to apply the knowledge and skills learned in real-world scenarios. Projects may involve analyzing datasets, performing EDA, building predictive models, and creating visualizations to present findings.
How is the course structured?
The course is structured into modules, each focusing on specific topics such as data preprocessing, statistical analysis, machine learning, and data visualization. Each module includes lessons, hands-on exercises, quizzes, and practical projects to reinforce learning.
Will I receive a certificate upon completion of the course?
Yes, upon successful completion of the course, you will receive a certificate of completion. This certificate can be a valuable addition to your resume and professional profile, demonstrating your proficiency in data analysis and visualization techniques.
How much time should I dedicate to this course?
The course duration may vary depending on your learning pace and prior knowledge. Typically, learners may spend a few hours per week studying and completing assignments. The course is self-paced, allowing flexibility to accommodate different schedules.
What software/tools will I need for this course?
You will need access to software tools such as Python (with libraries like Pandas, NumPy, Matplotlib, Seaborn, and Plotly) for data analysis and visualization. Instructions and resources for installing these tools will be provided in the course materials.
How can I get help if I have questions or encounter difficulties during the course?
The course may include discussion forums, Q&A sessions, or support from instructors or teaching assistants to help you with any questions or challenges you encounter. You can also refer to the course materials and additional resources provided for further assistance.
Please, login to leave a review


